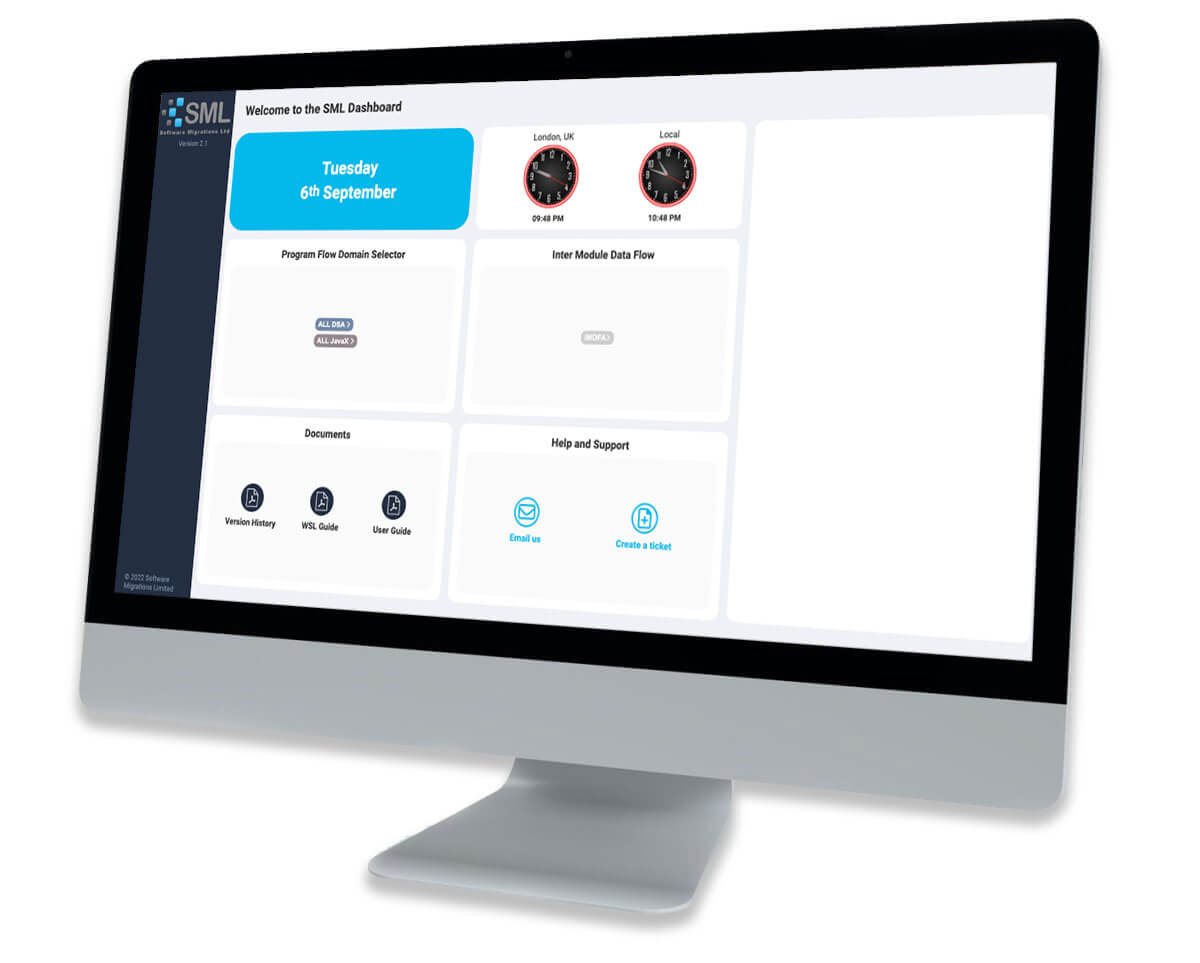
SML Dashboard
The Dashboard is a visualisation tool to provide insight into the processed code. It provides summary level information on; number of modules, lines of code and complexity. It also provides an overview of the relative size, complexity and distribution of the processed modules.
- Can be used to plan your modernisation project
- Full inventory of your Assembler modules with module level analytics
- Can be used to make sure the right modules are being worked on by the right people
- Can be used to track progress
At a module level, it provides real insight into all of the detail of the module.
There are automatic links between the Flowcharts, WSL Pseudocode and Assembler to ease comprehension and to cross-check for a deeper insight.

The Dashboard Summary Statistics for a sample project provide:
- Total Modules – the total number of modules called in the processed code
- Included – means the total number of called modules where we have processed the source code.
- Source Lines – the number of source lines is the total number of lines in the modules, macros and copybooks we have
- Executable lines – the number of lines actually executable – not including comments etc.
- Dead Code – the number of lines not accessible by any route through the code
- McCabe Complexity – Industry standard measure of code complexity, we provide a McCabe metric on the original Assembler, the restructured WSL Pseudocode and the improvement achieved in the restructure code.
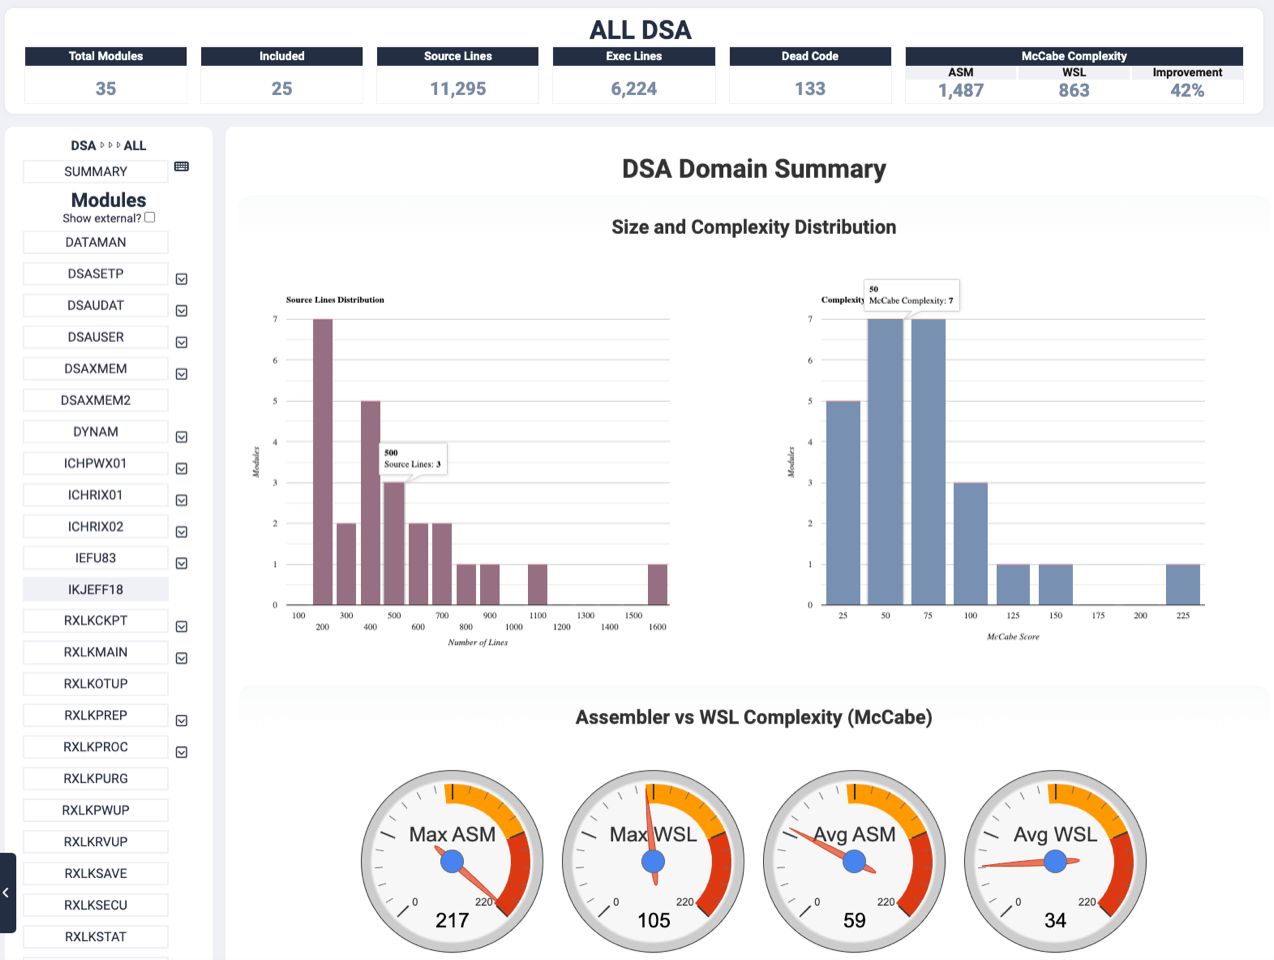
The Domain Summary shows graphical statistics of the subset including Size and Complexity Distribution graphs, Maximum/Average Complexity Gauges for Assembler and WSL, Top 20 Modules in terms of Complexity and Size, a breakdown of Executable v Dead Code and a pie chart of the Function Types.
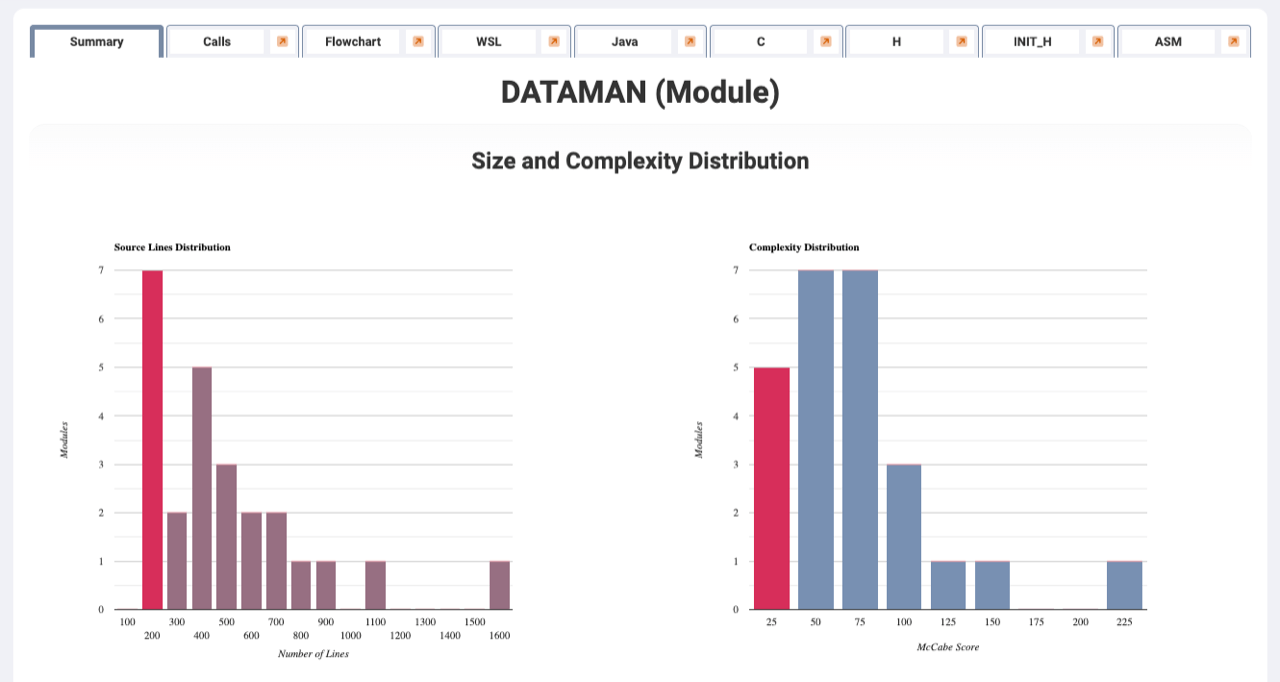
At a module-level it provides real insight into the detail of the module including the following artefacts:
- Statistics for the module – McCabe, Lines of Code( LOC)
- WSL Pseudocode
- Module Flowcharts with links to WSL Pseudocode
- Assembler with links to WSL Pseudocode and Flowcharts
- C or Java Pseudocode including Headers
- Original ASM Source
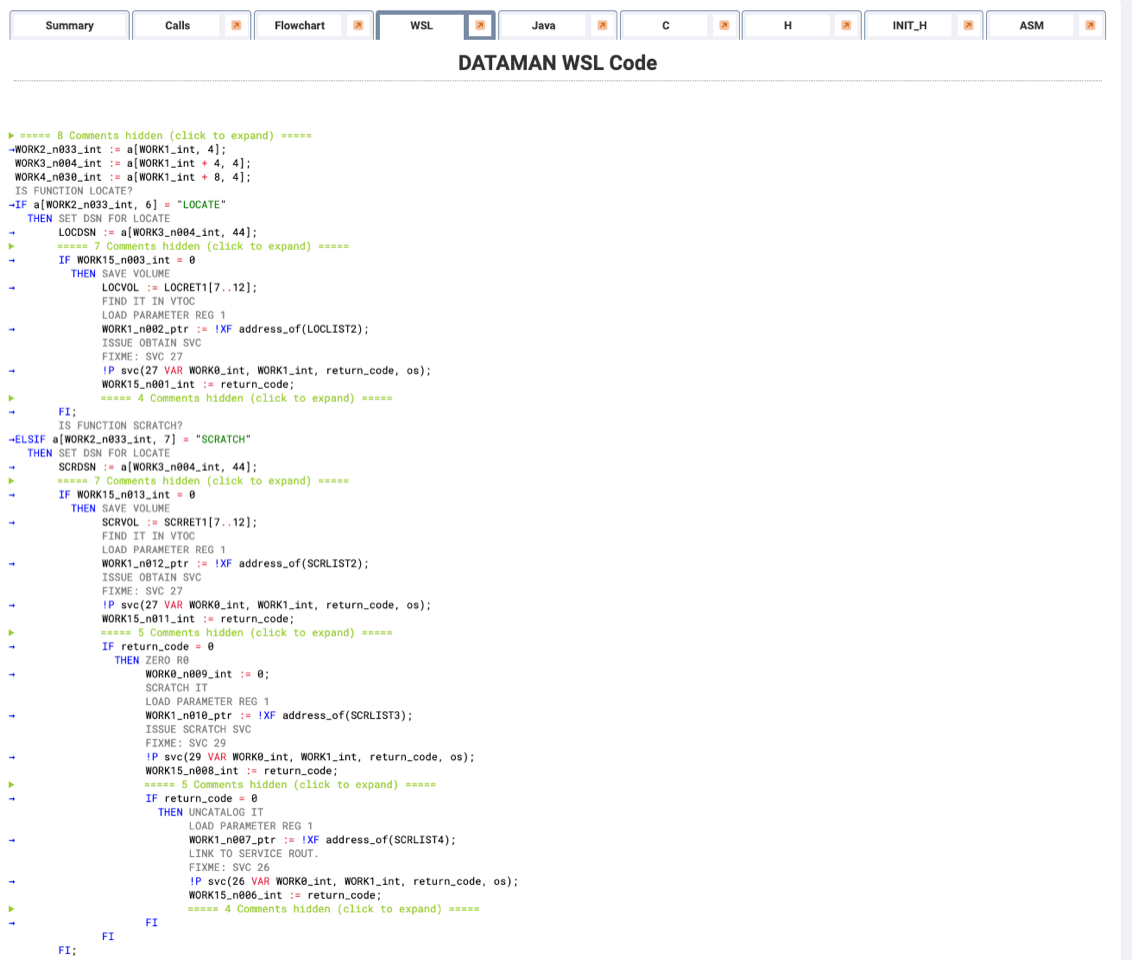
WSL Pseudocode can use customer translations of technical terms/data names to create more business type names and labels
WSL Pseudocode text is coloured to aid understanding the colours mean:
- Comments are grey
- Collapsed comment header lines are yellow-green
- TPF macro calls have a grey background
- WSL Keywords are blue (IF, DO, EXIT etc)
- Variables, fields, names are black
- Operators are crimson
- Strings are green
- Text inside curly brackets are {business descriptions of the previous statement}
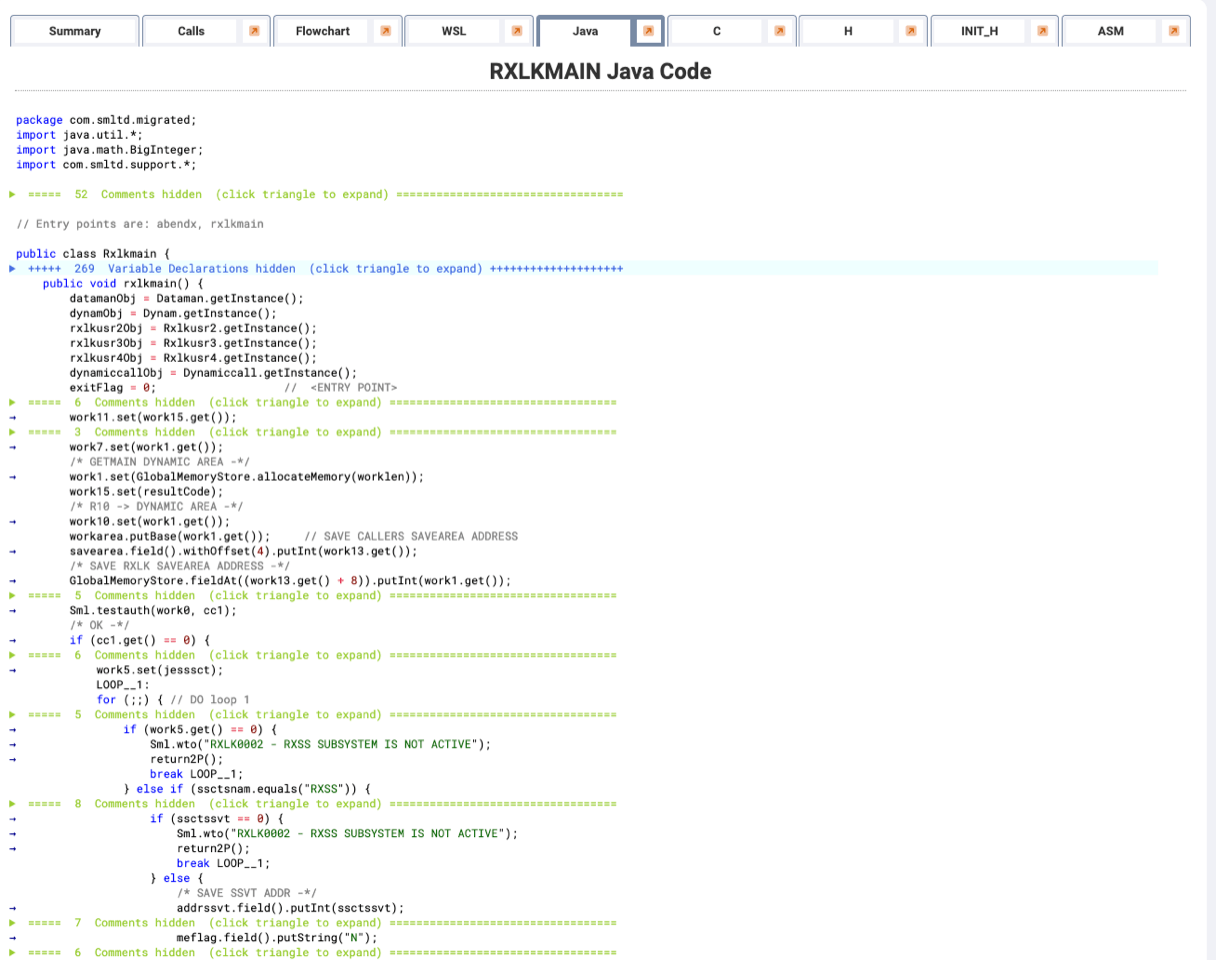
SML can also produce Java as the Target Language. Similar to the WSL, the text is coloured to aid understanding, and has links to the Assembler Source to ease comprehension and to cross-check for a deeper insight.
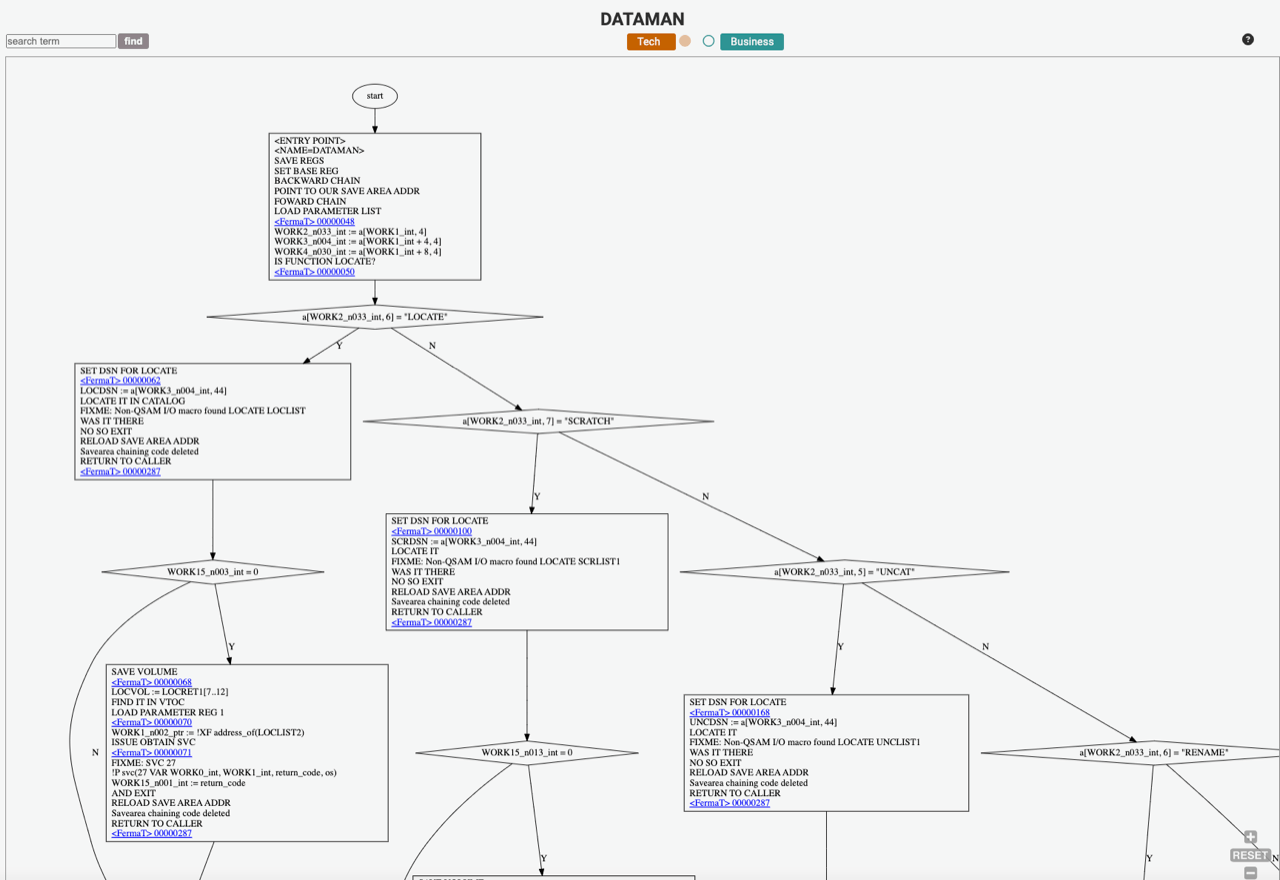
This is an example of a module flowchart, it fully navigable and where the text is brown there are customer translations to more accessible business style terminology. Just toggle on the Tech, Business buttons above or on the text itself